Technical Insight

Risk-Scoring For Journal Entries Using Data Analytics

Try Now & See it For Yourself.

Great reliance is placed on timely and accurate financial statements

Journal entries posted to the general ledger are the source of balance sheets, income statements, and statements of cash flows. To mitigate the risk of inaccurate journal entries, deploy data analytics for scoring each journal entry posting. Risks can arise from a variety of factors such as weak internal controls, aggressive fraudsters, and the increasing complexity of financial reporting systems.


What Are Journal Entries?

Journal entries are simply the debit and credit transactions that are applied to general ledger accounts. These entries are, in most organizations, automatically posted by one or more ERPs. Manual journal entries can also be posted by parties with the appropriate duties. The key fields that occur in journal entries are the amount, the GL account, the posting date, the DR/CR indicator, reference numbers, cost center, the user, and the creation date.

The Impact of Fraud

The ACFE conducts an annual survey of occupational fraud schemes. Although financial statement frauds are relatively low in number, the average financial statement fraud is nearly one million dollars, quite a bit more than the other categories.

Webpage - Risk-Scoring Image 1

ACFE "Report to the Nations: Global Study on Fraud and Abuse 2020"


Risk Scoring

Risk scoring is an effective way to isolate the journal entries that may indicate fraud, weak controls, and errors.

Here are the steps you can take to build a risk-scoring algorithm using your favorite data analysis tool.

  • Review risk indicators with your risk management Department and with your accounting department. This will ensure a common, unified approach in the assessment of risks.
  • Include characteristics that are common to industry, location, etc…as well as those that may be unique to your organization.
  • Apply risk scores to each transaction based on the transaction's characteristics.
  • Sum the risk scores.
  • Start your review with highest-scoring transactions.
  • Score can be a simple binary score (1 or 0).
  • Alternatively, you can weight each characteristic's score for impact and risk.
 

In this example, we've created four tests and applied a binary risk score if the journal entry meets the test. Each journal entry's score is then summed for an overall risk score. The highest-scoring entries should be reviewed first, followed by the next-highest, and so on. You can run several analytics on the high-scoring items, such as aggregating them by the person making the entry, the time period, the and the GL account. You can create a binary score using your data analysis application's conditional computed field functionality.


Webpage - Risk-Scoring Image 2
figure2: Risk-Scoring example

Basic Tests

  • Outliers by account
  •  Infrequent users
  • Round amounts
  • Unauthorized users
  • Manual entries
  • Immediately prior to or after end of period
  • Amounts just below approval limits
  • Holidays
  • Weekends
  •  Keywords
  • Duplicates
  •  Seldom-used accounts
  • Large credits to top-line revenue
  • Large credits to other revenue accounts
  • Whole-Population outliers

Summing the Scores

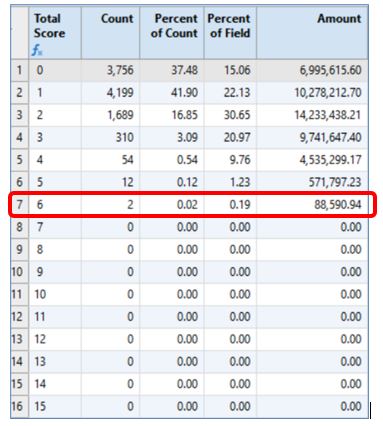
Once all the tests have been created, create another field to sum the scores for each posting. You can then run additional analytics to identify possible trends or commonalities. For example, you may want to use the Stratify command to see the frequency distribution of the total scores.

In this example, we can see that two journal entries had the highest score of 6. Their total materiality is nearly $89,000 or .19% of the total population materiality.

Fig 7: Risk-Scoring_Summing the scores

Other analytics to consider are frequency distributions by user, GL account, and other characteristics. The Classify command can produce the user distribution with the scores in descending order. This can be done by selecting the "By Size" and "All items" parameters in the Classify command dialog:

Webpage - Risk-Scoring Image 8

Webpage - Risk-Scoring Image 9


Best Practices

Here are some best practices to keep in mind:

  • Discuss risks with the risk management and accounting departments.
  • Identify risks that may be particular to your organization, industry, location, etc…
  •  Review risk scoring algorithms regularly.
  • Create a script to automatically execute creation of scores.

On-Demand Webinar

Risk-Scoring Journal Entries Using Data Analytics 


Watch now

Arbutus Technical Insights

Technical know-hows of Arbutus technology. 


Request Your Free Trial